 Figure 2


« Prev Next »
The entire DNA sequence of many organisms has been elucidated; these organisms include humans and many of the species researchers use to perform genetic studies. So, in an age in which we know the location of every gene (and every sequence that looks like a gene) in a particular species' genome, why would chromosome maps and linkage matter? The answer to this question is simple: Maps and linkage matter because we don't know what many of these species' so-called "genes" do.
The important thing to realize about linkage is that it helps researchers identify the locations on chromosomes at which specific genes exist. Indeed, linkage is critical for mapping and identifying genes when we are trying to discover which gene is responsible for a specific phenotype.
In a genetic screen, mapping allows scientists to link genes to their functions. To better understand how a genetic screen works, it helps to consider an example experiment. In this case, the example experiment seeks to answer the following question: What genes are responsible for blood vessel development and patterning?
Choosing a Model Organism
Choosing the right model organism for an experiment is one of the most important aspects of experimental design. For instance, if you want to study the vascular system, you should not use the worm C. elegans, as members of this species do not have a vascular system. However, Danio rerio, or zebrafish, are particularly useful for vascular studies. Zebrafish embryos are transparent, and they are so small for the first several days that even if there is a mutation that causes a fish's vasculature to be completely disrupted, the embryo can still survive by way of the oxygen that is diffusing through its tiny mass.
One of the predominant systems for genetic screens related to the vasculature of zebrafish was developed by scientist Brant Weinstein (Lawson & Weinstein, 2002). In this system, green fluorescent protein (GFP) is used to tag all of a fish's developing vessels (Figure 1).
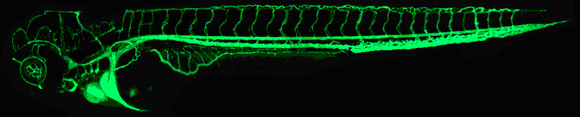
Figure 1: A 48-hour-old zebrafish embryo with the vascular system viewed using confocal microscopy.
The vasculature of this zebrafish embryo is visible through the use of green fluorescent protein (GFP). GFP is expressed under a vascular-specific promoter and does not affect normal development.
Brant Weinstein/National Institute of Child Health and Human Development/National Institutes of Health.
Designing the Experiment
A forward genetic screen is used to look for mutations that affect a biological process. In our example experiment, we are looking for mutations that alter how a zebrafish's vasculature develops. Thus, our first step is to induce mutations. To do this, we must treat the male fish with a chemical; here, we opt for ethylnitrosourea (ENU), which causes mutations in zebrafish spermatogonia. The male fish that carry this mutation are then crossed to wild-type females.
Next, from this initial P cross, we collect the male fish that should be heterozygous for the mutant recessive allele. These fish are the F1 males, and they are crossed to wild-type females. Each F1 pair thus generates an F2 family of fish, half of which are expected to be heterozygous for the mutation and the other half of which are expected to be homozygous for the wild-type allele. After that, we cross males and females from the same family, investigate the F3 progeny from thousands of different families, and look for a phenotype of interest in the F3 generation. This is a large-scale genetic screen (Figure 2).
In our experiment, each fish has a transgenic GFP background and thus has green blood vessels. Thousands of F2 families are screened. Nothing specific has been done to alter the genes directly involved in the fishes' vascular development. Rather, we observe many different phenotypes in the F3 progeny. However, we follow only those embryos exhibiting a phenotype in their blood vessels, because these fish carry mutations for a gene involved in vascular development. In fact, the F2 families that do not carry vascular mutations are no longer pursued.
So, what would it mean if a mutant phenotype were seen in 25% of the F3 progeny? This would signify that the mutated gene is recessive, and that the mutant fish must therefore be homozygous for the mutated gene. On the other hand, what would it mean if a mutant phenotype were seen in 75% of the F3 progeny? This would indicate that the mutant gene is dominant, and that heterozygous fish have the vascular problem as well.
What’s Next?
Once we've determined our phenotype of interest in the F3 generation (here, abnormal vascular development), it is necessary to link that phenotype to a region on a specific chromosome. We do this by looking at specific genetic markers, such as known polymorphisms or repeated sequences, and seeing which ones are tightly linked to our phenotype—in other words, which ones are consistently found in our progeny with blood-vessel problems.
Zebrafish have numerous described polymorphisms, and each year more are added to a shared database at the Zebrafish International Resource Center. The closer a marker is linked to our phenotype (meaning we observe fewer recombination events), the more confidence we have that we know where the mutation is on the chromosome. In other words, the infrequency of recombination (when our marker and our phenotype diverge) suggests a physical closeness of the marker with the gene responsible for the phenotype under study. Indeed, such distances are denoted by a unit measure called the centimorgan (cM), which is related to the frequency of meiotic recombination and the pattern of segregation and inheritance of different markers within families. A genetic distance of 1 cM corresponds to roughly 1 megabase (Mb), or one million nucleotides.
After a region that seems close to our gene is found, we can look at the sequence of that region and find the genes in that area. Often there are candidate genes—genes that you might suspect to be involved because you already know they are expressed in the vasculature, for example. Other times, the mutation is not in any known gene, and you must perform DNA sequencing in the wild-type and the mutant organisms to discover the specific mutation responsible for the phenotype. In any case, showing that there is a sequence difference between the two is the definitive step in identifying the gene responsible for the change in blood vessels.
Thus, without understanding recombination and linkage, we would not be able to perform the genetic screens that allow us to narrow down the search for the figurative needle in a haystack. We also would not have reached an understanding of the functions of our gene of interest. Multiply our experiment across several species and many genes, and the importance of understanding the relationships between genes, structure, and function becomes readily apparent.
References and Recommended Reading
Lawson, N. D., & Weinstein, B. M. In vivo imaging of embryonic vascular development using transgenic zebrafish. Developmental Biology 248, 307–318 (2002) doi:10.1006/dbio.2002.0711
Patton, E. E., & Zon, L. I. The art and design of genetic screens: Zebrafish. Nature Reviews Genetics 2, 956–966 (2001) doi:10.1038/35103567 (link to article)